Cash Loss Detection
I built the AI investigation platform every Walmart store in the US and Canada runs on, cutting investigation time 60–70% and recovering $2M at launch.
- Role
- Product Manager III
- Dates
- April 2025 to March 2026
- Team
- 6 engineers across the US and India, plus data science
- Scope
- 600K high-risk items weekly, $53M in cash loss
- Status
- In production
The problem
Before this platform existed, investigating a flagged item meant stitching together data from sources that were never designed to talk to each other. Investigators worked across email threads and spreadsheets, with no shared record of what had already been looked at, what had been actioned, or why. Nothing scaled. Every store, every week, the backlog grew.
Starting with the researchers
I didn't start with the technology. I started by sitting with the researchers who'd spent years learning to spot patterns nobody had ever codified, and worked with them to turn that judgment into prioritization rules a system could act on.
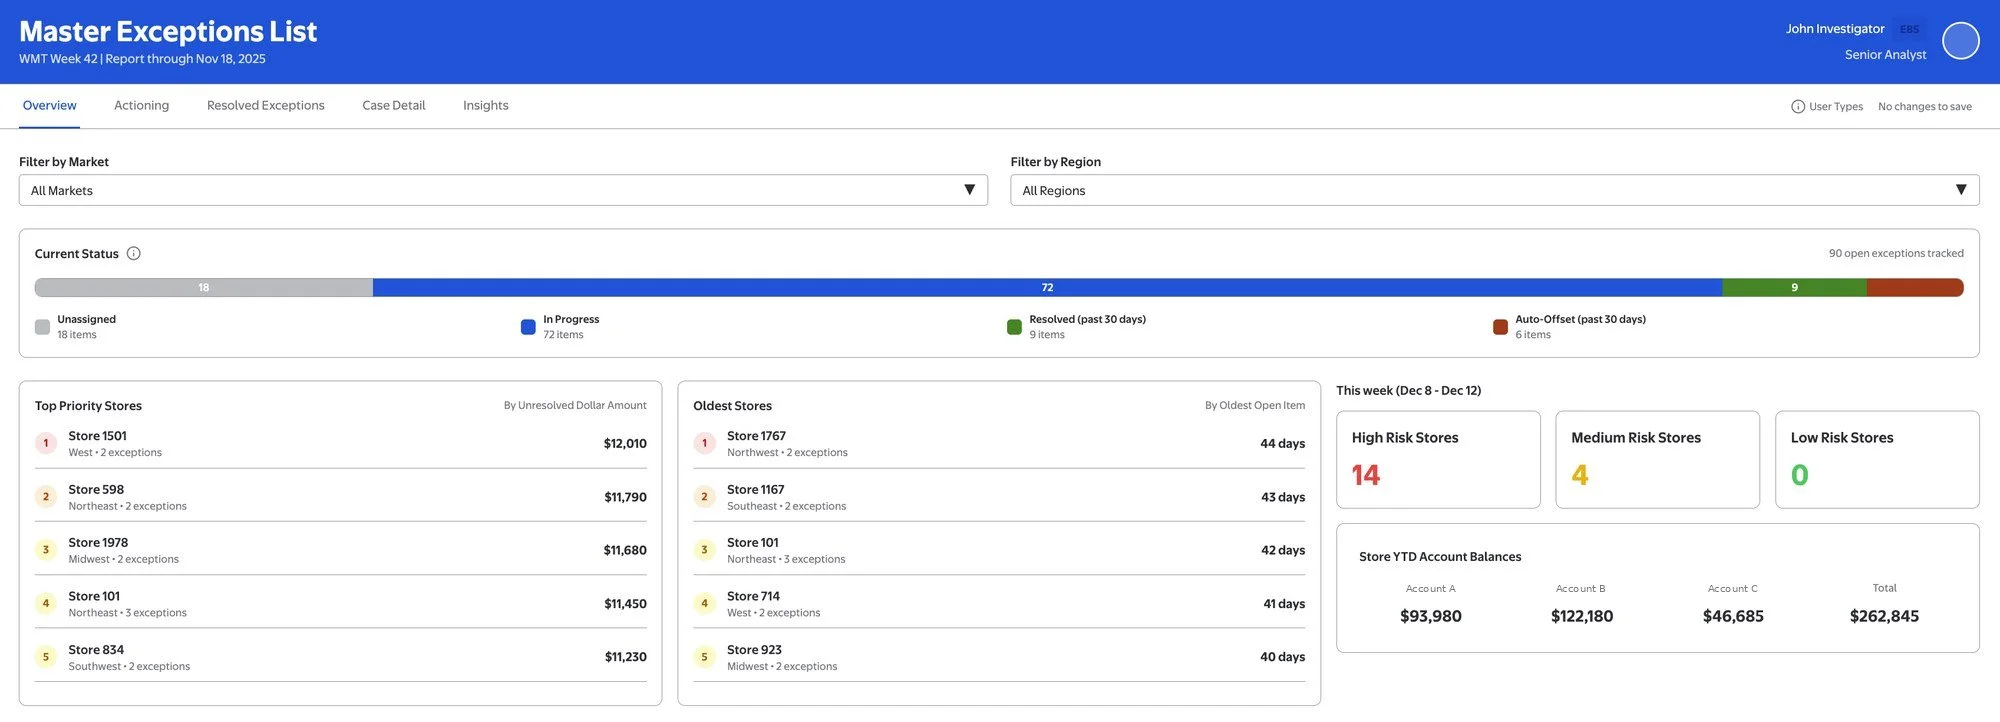
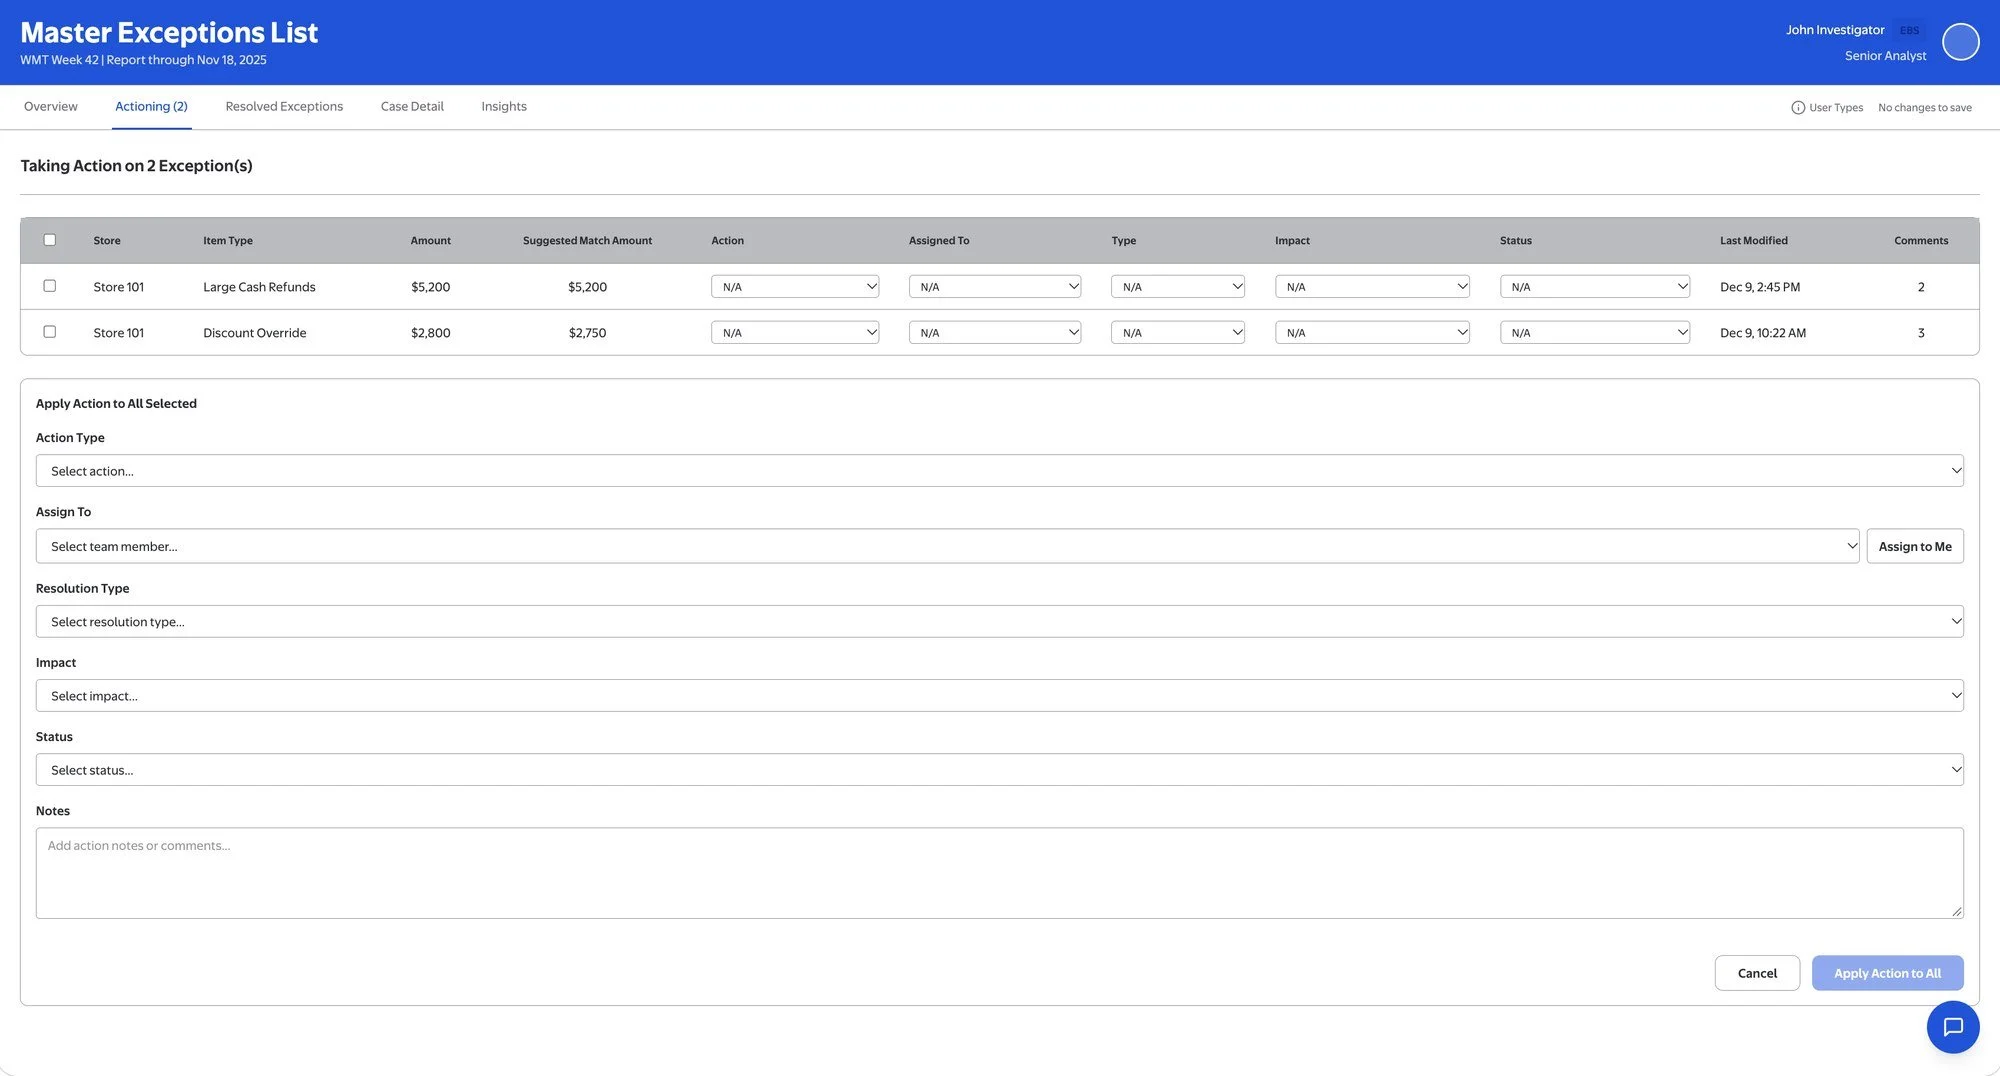
Before engineering committed a sprint, I designed and prototyped the investigator portal in Figma Make, so stakeholders could react to something concrete instead of a spec. The screens below are from that prototype, with dummy data.
A data foundation that only shows true risk
The only starting point was 54 raw tables. I architected the data foundation on top of them: a semantic layer, an optimized Power BI report, and reconciliation logic that discards errors that resolve on their own inside the window. Those were never real risk, so they never reach an investigator.
An agent that acts, not just flags
I presented the product to leadership to win data science resourcing, then partnered with that team on a domain agent. It auto-resolves what it can, prioritizes each truly at-risk line item, and routes it to the right researcher.
Two choices that shaped the portal
Two decisions shaped the portal: what a researcher sees the moment they log in, and what happens to everything they do after that.
A record that makes it an audit tool
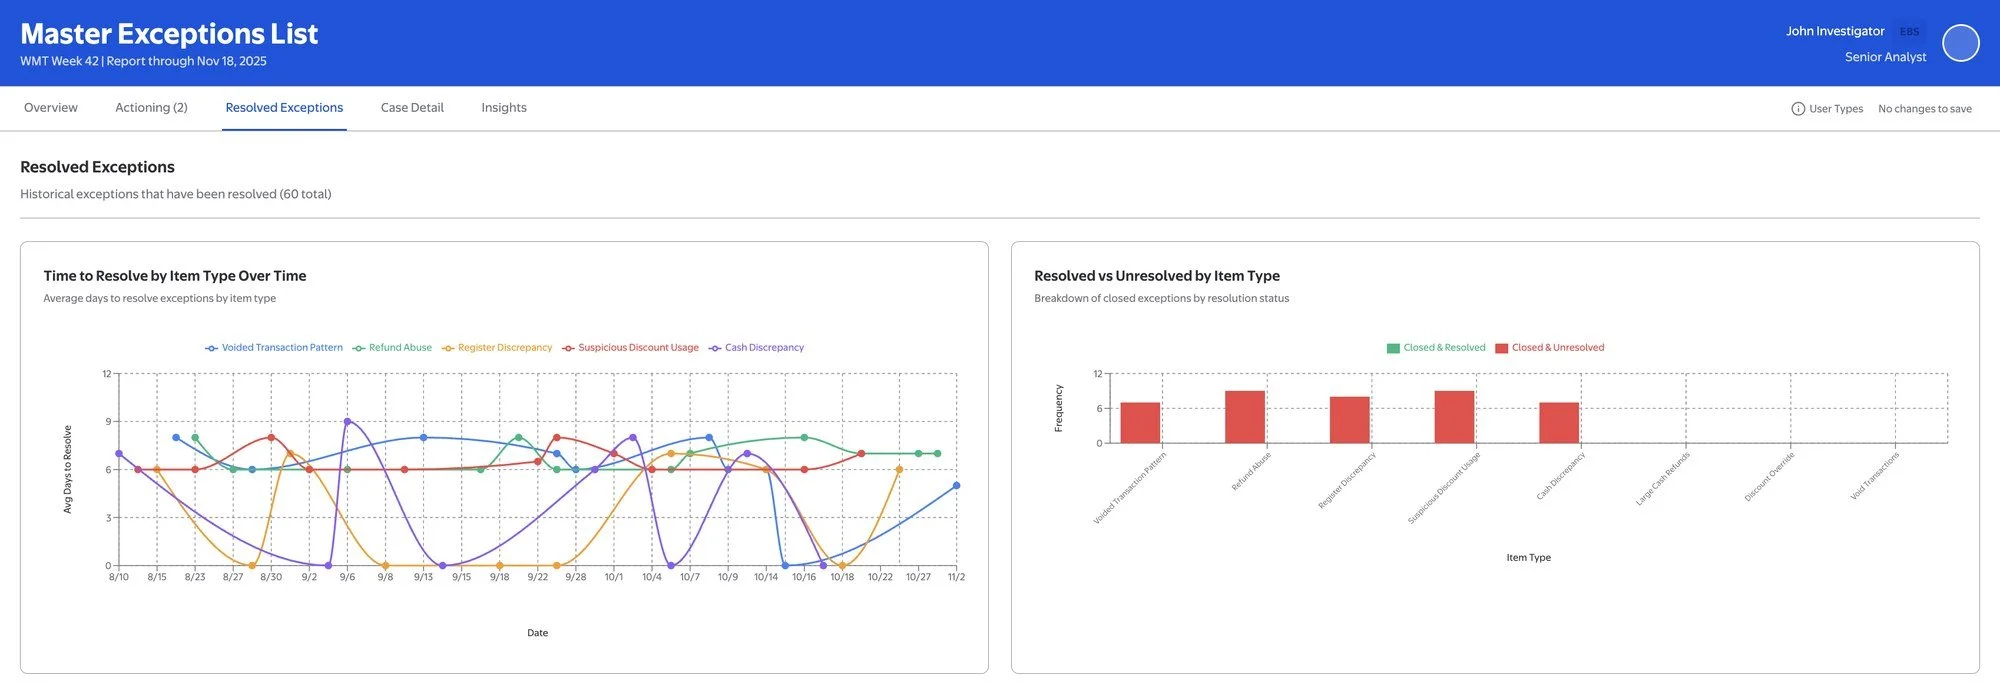
Line items close when the money is recovered or when the case reaches closure without recovery. Because every resolution is kept, the team can see how long each type of exception takes to resolve, what gets closed unresolved, and where confirmed loss comes from.
The bigger decision
The bigger call was architectural: consolidate every fragmented source into one pipeline, instead of patching the spreadsheets people already had. That was a heavier lift up front, but patching would have left the real problem — the manual wrangling underneath the backlog — untouched.
Looking back
The biggest shift for me was realizing how much more a clickable prototype does than a requirements doc. I could put something in front of stakeholders and watch them react to it in real time, iterate on the spot, and hand engineers something unambiguous instead of a spec they'd have to interpret. And there was something particularly satisfying about this one specifically — the research team had been doing every bit of it manually, store by store, with no real technical support before I joined. Watching that actually change was the whole point.